

Performance
- Port Statistics 2019
- Port Statistics 2018
- Port Statistics 2017
- Port Statistics 2016
- Port Statistics 2015
- Port Statistics 2014
- Port Statistics 2013
- Port Statistics 2012
- Port Statistics 2011
- Port Statistics 2010
- Port Statistics 2009
- Port Statistics 2008
- Port Statistics 2007
- Port Statistics 2006
- Port Statistics 2005
- Port Statistics 2004
- Port Statistics 2003
- Port Statistics 2002
- Port Statistics 2001
- Port Statistics 2000
- Port Statistics 1999
- Port Statistics 1998
Port Statistics 2019
Port Performance
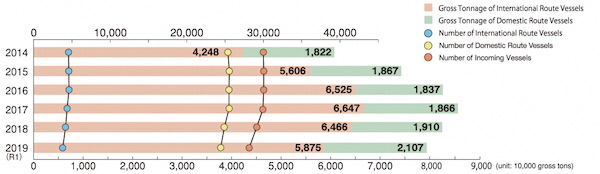
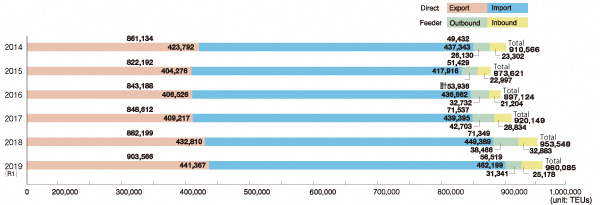
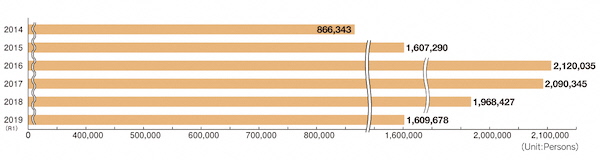
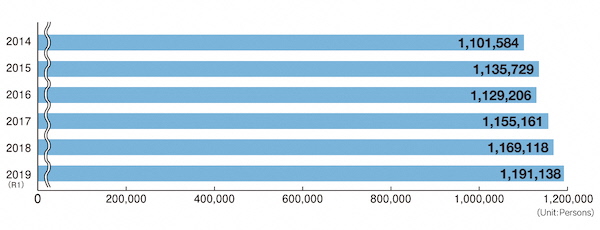
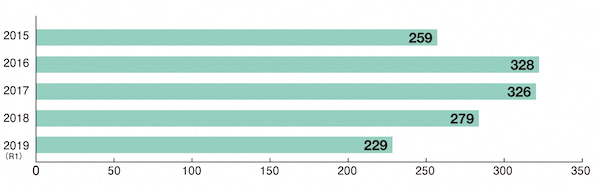
Domestic and foreign vessels calling at Hakata Port in 2019 numbered 28,351 or about 79.82 million gross tons. The freight via the port was about 34.84 million tons (101.7% from the previous year). The number of international seaborne containers was some 960,000TEUs (100.7% from the previous year).
↓Changes in Number of Incoming Vessels
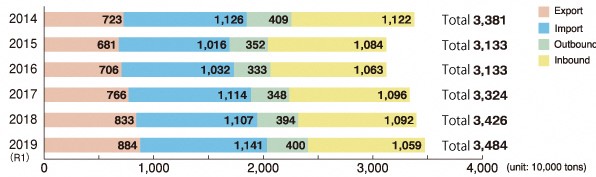
↓Changes in Seaborne Cargoes
↓Changes in Number of International Seaborne Containers
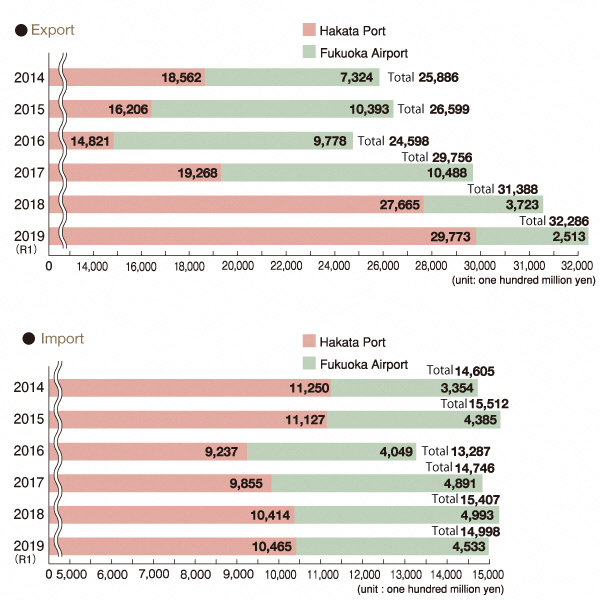
↓Changes in Trade Value
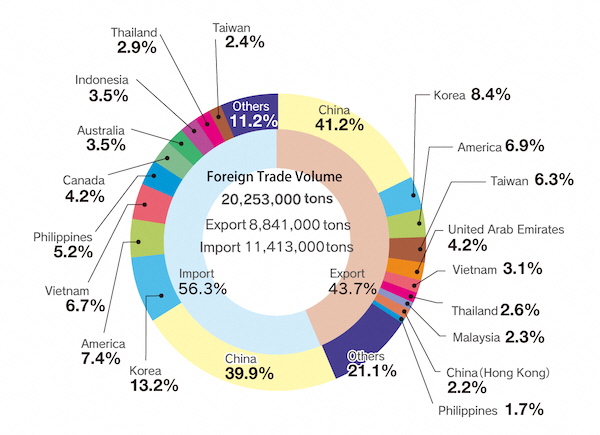
Foreign Trade
Foreign trade volume in 2019 totaled 20.25 million tons, of which imports accounted for 56.3%. Most imports are daily necessities consumed in neighboring areas. Industrial products such as automobiles and rubber products, and recycled materials accounted for the majority of exports. Main trading partners are East Asian, Southeast Asian and North American countries.
↓Foreign Trade (Export and Import by Country and Region)
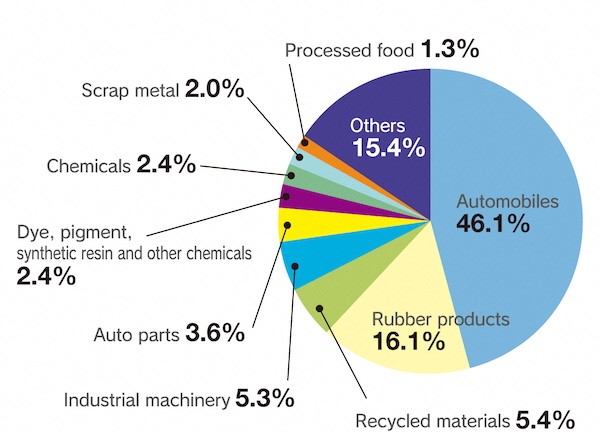
↓Exports by Item
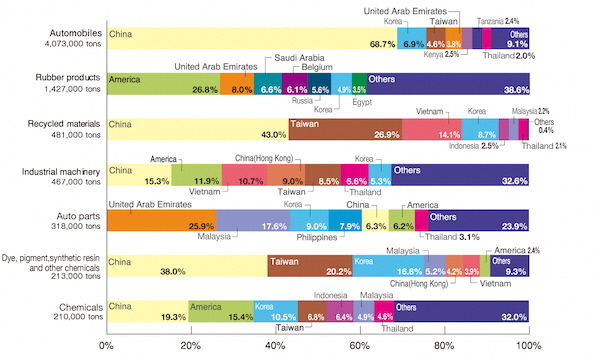
↓Major Export Counterparts of Top 7 Items
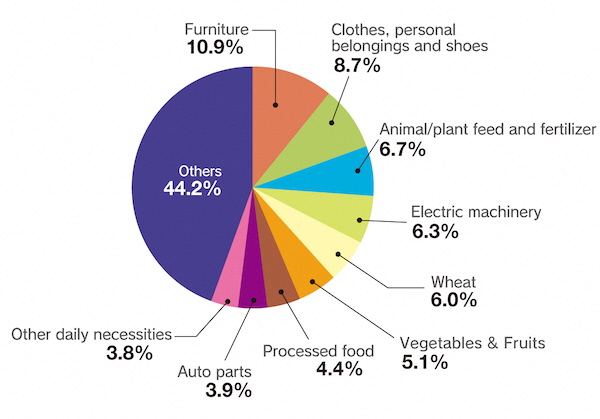
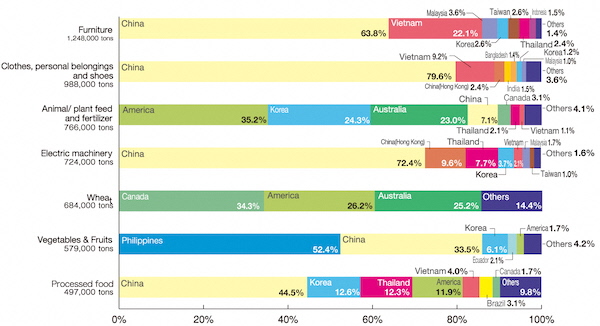
↓Imports by Item
↓Major Import Counterparts of Top 7 Items
Domestic Trade
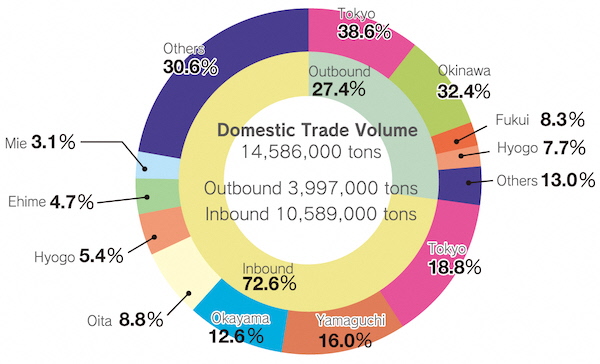
The 2019 domestic trade volume of Hakata Port was 14.5 million tons, of which inbound cargo accounted for 72.6%.
↓Outbound / Inbound Trade by Prefecture
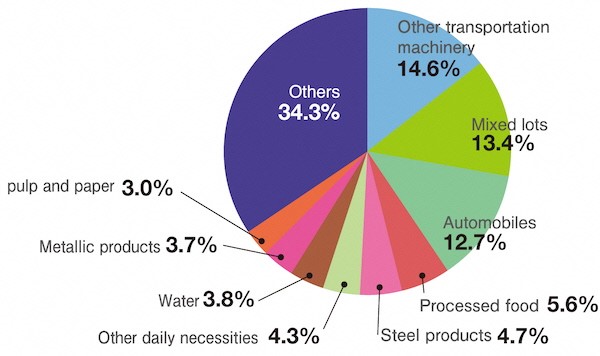
↓Outbound Trade by Item
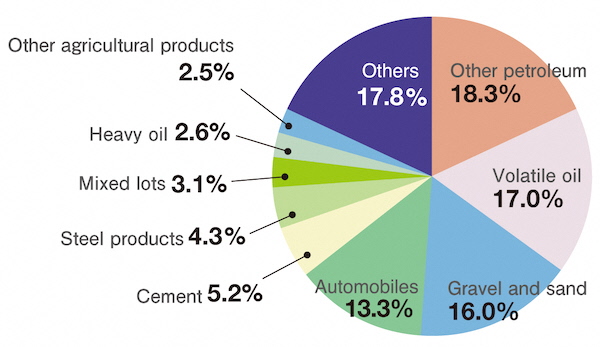
↓Inbound Trade by Item
Ship Passengers
↓Changes in Number of International Passengers
↓Changes in Number of Domestic Passengers
Cruise Ship Calls
Port Statistics 2017
Port Statistics 2016
Port Statistics 2015
Port Statistics 2014
Port Statistics 2013
Port Statistics 2012
Port Statistics 2011
Port Statistics 2010
Port Statistics 2009
Port Statistics 2008
Port Statistics 2007
Port Statistics 2006
Port Statistics 2005
Port Statistics 2004
Port Statistics 2003
Port Statistics 2002
Port Statistics 2001
Port Statistics 2000
Port Statistics 1999
Port Statistics 1998
 福岡市 港湾空港局
〒812-8620 福岡市博多区沖浜町12番1号 [地図・アクセス]
[組織一覧・各課お問い合わせ先]

Copyright(C)Fukuoka City.All Rights Reserved.